


Intro
Joe Willage
Data all day
Intro
Joe Willage
Data all day

|
|
|
analytics_brief
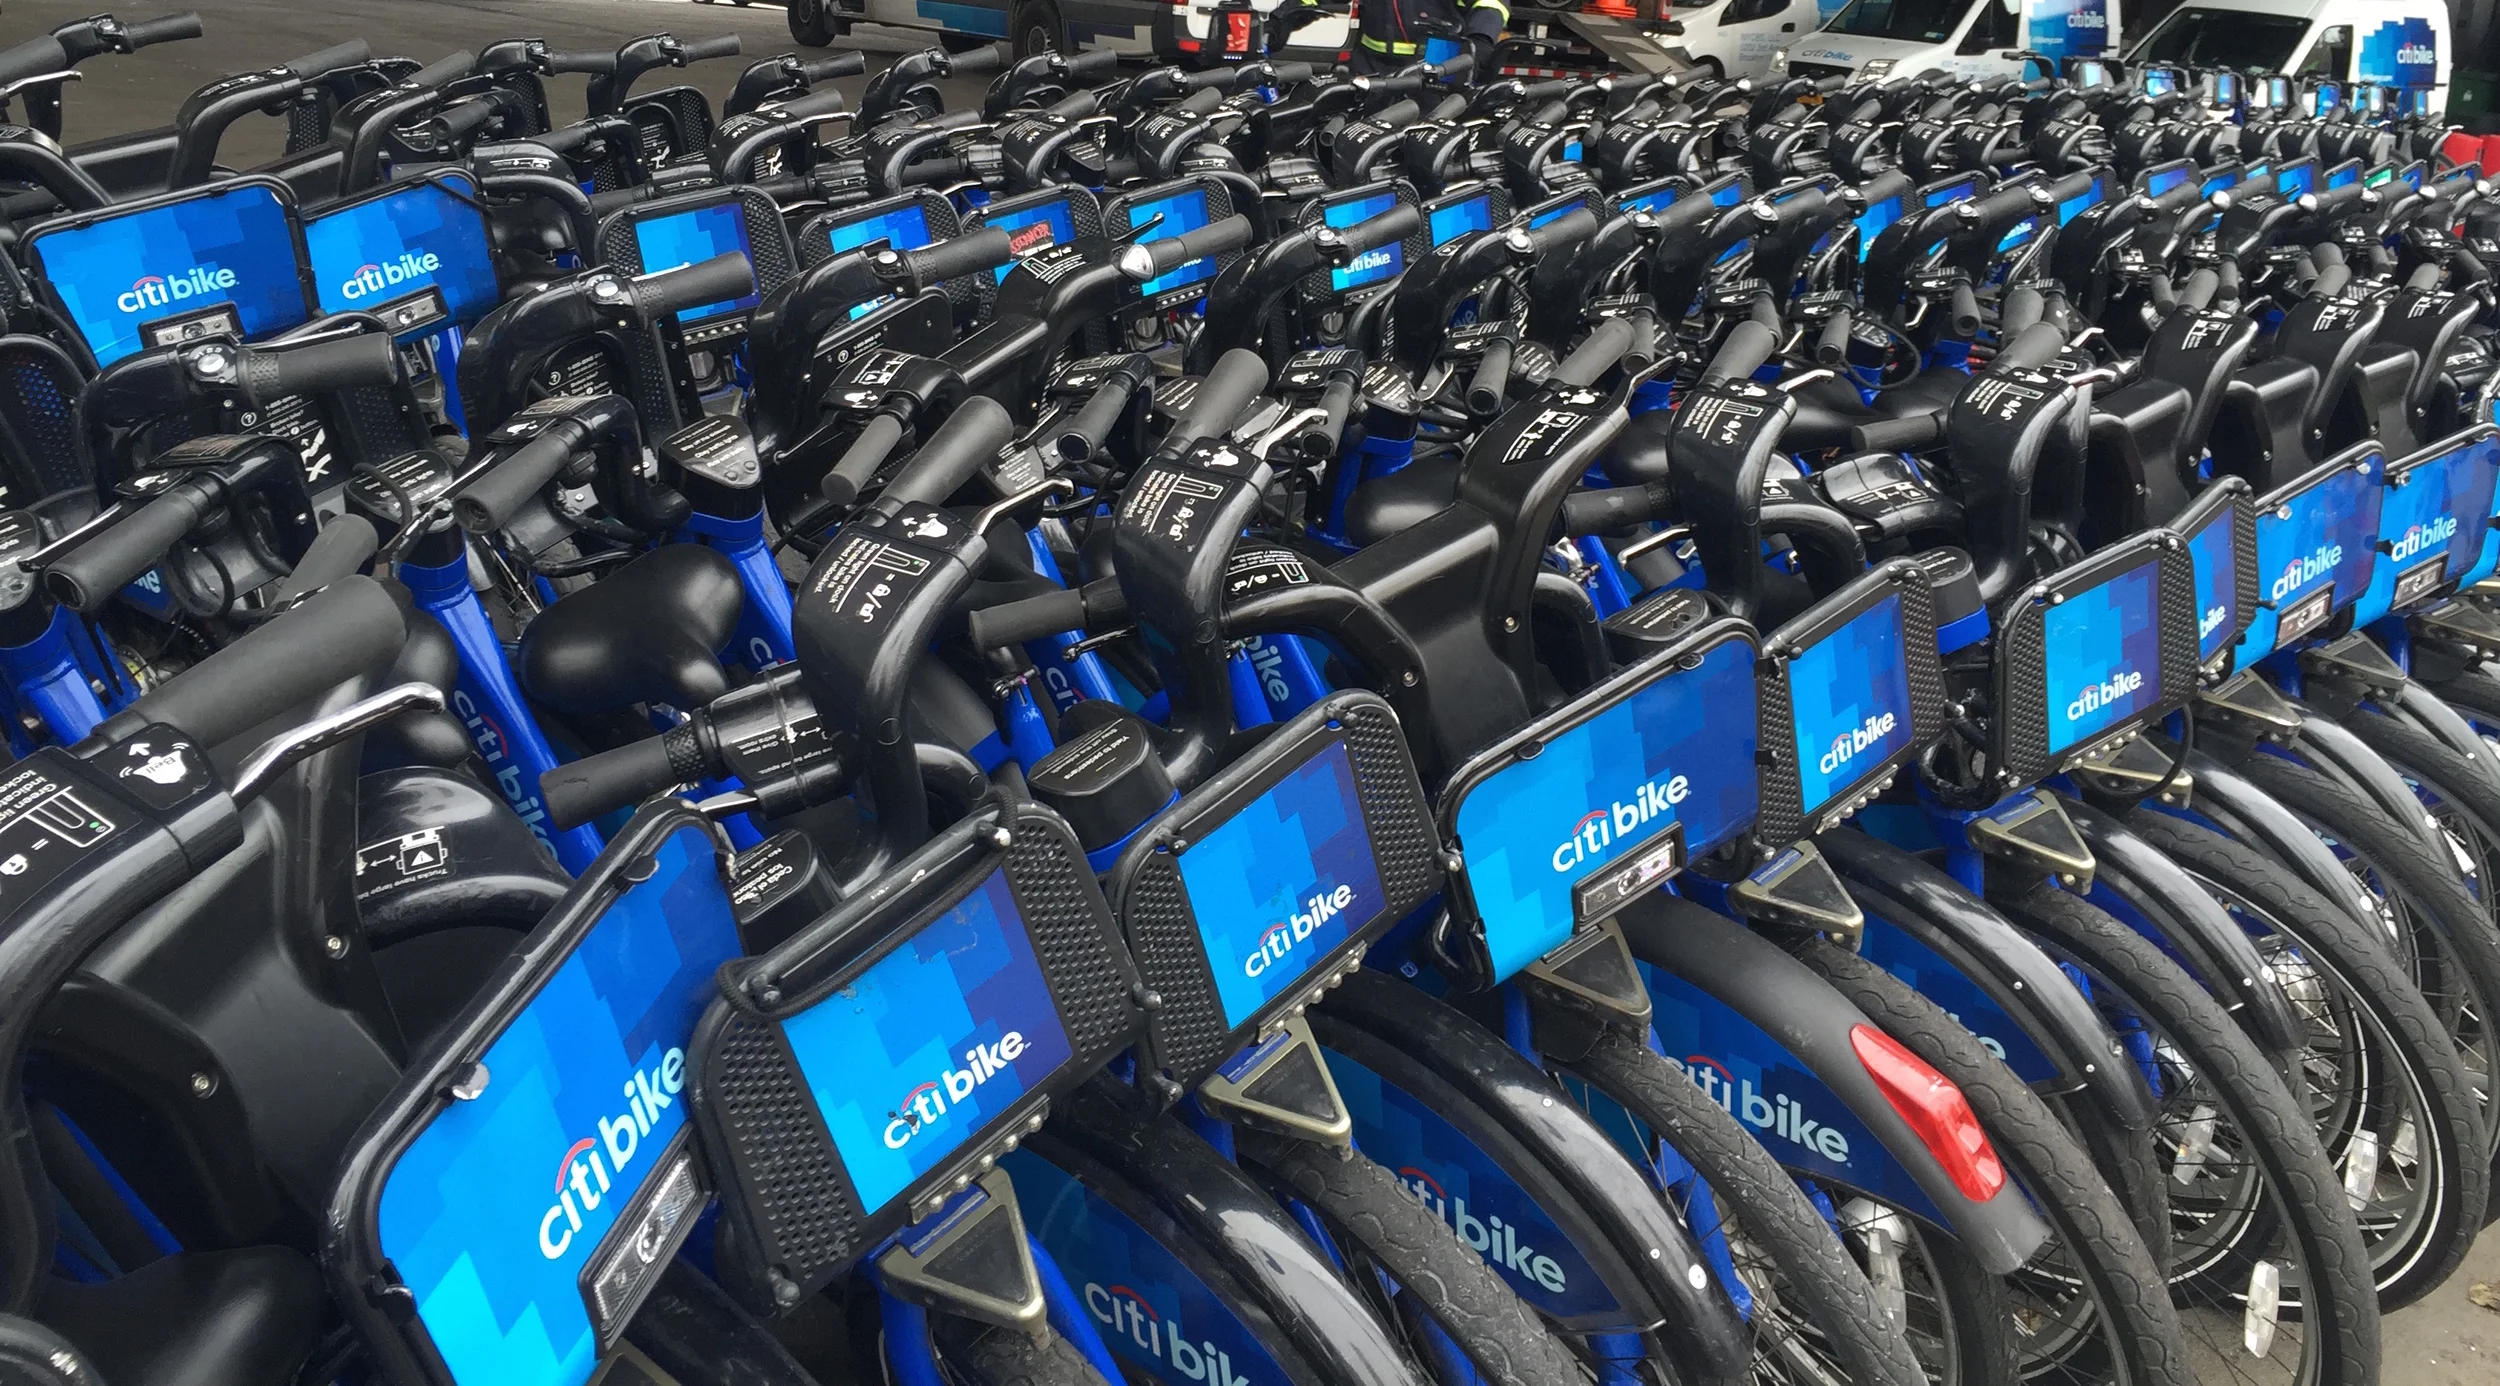
Analyses on subjects ranging from Citi Bike ridership to the impact of severe weather events
analytics_brief
Analyses on subjects ranging from Citi Bike ridership to the impact of severe weather events
The Citi Bike project aims to quantify user trends during trips. It's an ambitious on-going effort that combines publicly available trip data with Google Maps APIs. Heterogeneous data is brought together, distances and times are converted, and the result is a tidy data set that can be used downstream. Analytics on this data have included hypothesis testing, residual analysis, and linear and sinusoidal regression. Some of the findings to date include the surprising fact that the average trip is just 12.5 minutes, and that trips by women last about 18% longer than that of men. Check it out.
The Impact of Severe Weather Events is a paper that investigates just that. Data from the NOAA Storm database is cleaned, filtered, and aggregated. The resulting analysis explores the weather events that are most harmful to human health (by injury and fatality rate), as well as which events are most economically harmful (by property and crop damage). Flooding was found to have the greatest impact on property, while drought accounted for the most of the crop damage. See the full analysis, along with the deadliest weather event here.
nlp_brief
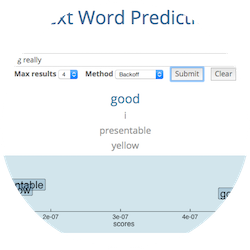
Natural Language Processing application that predicts text based on input
nlp_brief
Natural Language Processing application that predicts text based on input
Next Word Prediction is an NLP-based app that uses n-gram models to predict the next word in a string. The project was designed to explore the possibilities of NLP and compare different methods of assigning probability. The models are built on over 5 million articles of text from Twitter, news sources, and blogs. Texts were pre-processed, tokenized, and filtered for profanity and non-words. Part-of-speech tagging was also implemented to learn which words are most likely to appear after certain parts of speech. The models and algorithms are deployed on Shiny, and users can choose from two prediction methods: backoff and interpolation, and are presented with the top predictions and a graph of their respective scores. The app can also be extended to perform text generation. See it here.
viz_brief
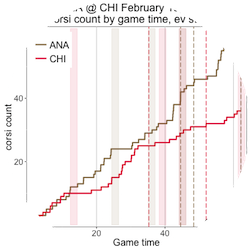
Visualize NHL team performance throughout the game
viz_brief
Visualize NHL team performance throughout the game
Hockey is a project to help visualize NHL in-game events between teams. Which team had more giveaways? How many shots on goal did each team have? What about Corsi? And how did they fare on even strength vs power play? Hockey is a multi-faceted project, that uses Python to scrape and shape data from NHL.com. Aggregation and visualization, with R, shows users how teams performed as the game progressed, for any given event and any given strength. More.